Feature Release: July 13

Today, we released a new set of features. The primary feature is a new auditing tool that helps data engineers quickly profile a data set in terms of column cardinality, row count and the constituent file count. This simple feature gives a quick snapshot of a dataset and identifies any potential data issues. In a production pipeline this prevents corrupted data being dispatched.

Data Audit Icon

Clicking the icon performs the audit. Once completed all information is viewed in the information page for each data set.

Data Knowledge Graph

When you are building data products and filtering data files, it is important to keep track of what you have combined to make a new data set and what you have removed. This feature has saved us countless hours.

From an audit perspective we can build a complete history of a dataset - when it was added to the platform, how it was processed and when/who/where it was delivered / downloaded. This takes a removes a time-draining communication burden from our teams.

We can also add commentary and narratives to a data set. This helps us build transparency and persistent-state knowledge about data.

High Praise

On a demo of our application to a prospective customer, the instant feedback was "this looks easier to use than Alteryx". We'll take that sort of compliment any day of the week.

Building Persistent State Knowledge

The tools available to produce charts and visualize data are sadly lacking in a critical area. While much focus has been placed on producing interesting visualizations, one problem has yet to be solved: it is all too easy to separate the Data layer from the Presentation layer in a chart. It is easy for the context of a chart to be lost when it becomes separated from its source. When that happens we lose meaning and we potentially introduce bias and ambiguity.

In plain english, when you produce a chart in Excel or Google Sheets, the source data is in the same document. When you embed that chart in a PowerPoint or Google slide deck you lose some of the source information. When you convert that presentation into a PDF and email it to someone, you risk losing all connections to the source. Step by step it becomes too easy to remove context from a chart.

Yes, you can label the chart. You can cite your source but neither are foolproof methods. These are like luggage tags, while they are attached they work but they are all too easy to remove.

In analytics, reproducibility and transparency are critical to building a credible story. Where did the data come from, could someone else remake the chart following these instructions (source, series information, filters applied, etc). Do the results stand up to objective scrutiny?

At Knowledge Leaps, we are building a system that ensures reproducibility and transparency by binding the context of the data and its "recipe" to the chart itself. This is built into the latest release of our application.

When charts are created we bind them to their source data (easy) and we bind the "recipe". We then make them easily searchable and discoverable, unhindered by any silo information i.e. slide, presentation, folder, etc.

The end-benefit data and charts can be shared without loss of the underlying source information. People not actively involved in creating the chart can interpret and understand its content without any ambiguity.

Turning Analysis On Its Head.

Today we rolled out our new charting feature. This release marks an important milestone in the development of Knowledge Leaps (KL).

Our vision for the platform has always been to build a data analysis application platform that lets a firm harness the power of distributed computing and a distributed workforce.

Charts and data get siloed in organisations because they are buried in containers. Most charts are contained on a slide in a PowerPoint presentation that sits in a folder on a server somewhere in your company's data center.

We have turned this on its head in our latest release. Charts that are produced in KL remain open and accessible to all users. We have also built in a collaborative interpretation feature where a group of people spread across locations can interpret data as part of a team rather than alone. This shares the burden of work and build more resilient insights since people with different perspectives can build the best-in-class narrative.

Awareness Doesn’t Diminish Bias Effect

In an interview with Shane Parrish the co-creator of Behavioral Economics, Daniel Kahneman, was asked if he was better at making decisions after studying decision-making for the past 40 years. His answer was a flat no. He then elaborated, saying that biases are hard for an individual to overcome. This dynamic is most evident in the investment community, especially start-up investors. WeWork is a good case study in people ignoring their biases. An article in yesterday's Wall Street Journal (Paywall) describes WeWork's external board and investors looking on as the firm missed projections year-after-year. On the run up to the IPO, people were swayed by their biases and despite data to the contrary more gasoline was poured on the fire. It took public scrutiny for the real narrative to come out and for people to see their own biases at play. To be fair to those involved, the IPO process was used to deliver some unvarnished truths to WeWork's C-suite. As Kahneman said, even professional analysts of decision-making get it wrong from time to time. 

What hope do the rest of us have? With the right data it is easier to at least be reminded of your biases, even if you choose to accept them. With our data and analytics platform we have built two core components that give you and your team a greater opportunity of not falling into a bias trap.

Narrative Builder

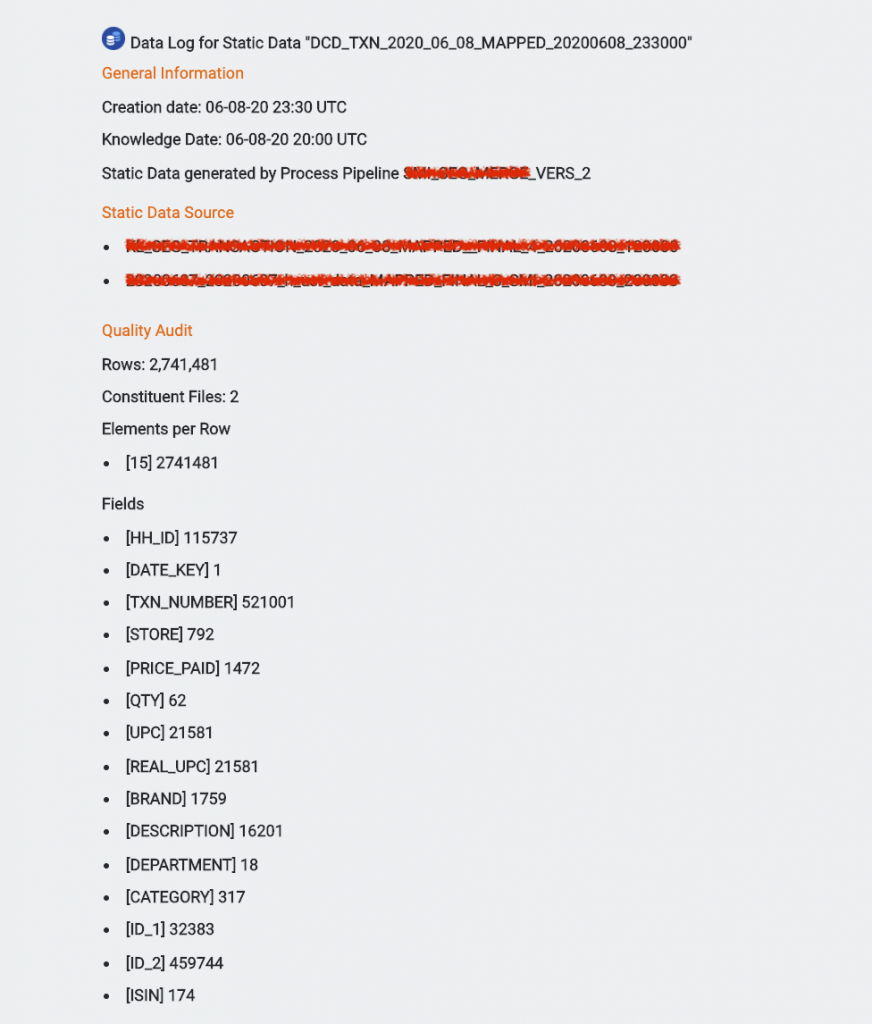
This component uses an algorithm that outputs human-readable insight into the relationships in your data. Using correction techniques and cross-validation to avoid computational-bias you can identify the cold-facts when it comes to the relationships (the building blocks of the narrative) in your data. 

Collaborative Insight Generation

The second component we have built to help diminish bias is a collaboration feature. As you analyze data and produce charts other members of your team and provide input and hypotheses for each chart. Allowing a second, third or even fourth pair of eyes to interpret data helps build a resilient narrative.

Surfacing a bias-free narrative is only part of the journey, we still need to convince other humans, with their own biases, of the story discovered in the data. As we have learnt in recent years, straight facts aren't sufficient conditions of belief. At least with a collaborative approach we can help overcome bias traps.

Surfacing a bias-free narrative is only part of the journey, we still need to convince other humans, with their own biases, of the story discovered in the data. As we have learnt in recent years, straight facts aren't sufficient conditions of belief. At least with a collaborative approach we can help overcome bias traps.

One Chart Leads To Another, Guaranteed.

We have just released the charting feature in Knowledge Leaps. The ethos behind the design is this: in our experience, if you are going to make one chart using a data set you are probably going to make many charts using the data.

Specifying lots of charts one-by-one is painful, especially as a data set will typically have lots of variables that you want to plot against one specific variable, date for example. Our UI has been built with this in mind: specify multiple charts quickly, and simply, then spend the time you save putting your brain to work figuring out what the data narrative is.

Charts tend to get buried further into a silo - either as part of a workbook or a presentation. This requires contextual knowledge: to know where the chart is. In other words, you need to know where the chart is to know what story it tells. This is suboptimal, so we fixed that too. Knowledge Leaps platform lets all the your charts remain searchable and shareable. That also goes for your co-workers' charts as well. This feature allows insight to be easily discovered and shared with a wider team - helping build persistent-state organizational intelligence, faster.

No Code Data Engineering #2

We are adding to our no-code data engineering use cases. Our new Collection Manager feature plugs data pipelines into databases with no code just using a simple drag-and-drop interface.

This feature allows users with zero knowledge of databases and query languages to import data into a database. An additional UI will then allow them to create queries, aggregations and extracts using a simple UI.

The UI can be set up to update the database with new data as it is arrives from external sources, it will also automate extract creation as new data is added.

Example use-cases for this feature would be in the creation of data feeds for dashboards that auto-populate, or creating custom data products which can be timed with a guaranteed delayed delivery time. This feature will also drive our retail experimentation business - we can design and set up a data framework that captures and tags the results from test-and-learn activity.

Code-free Data Science

There will always be a plentiful supply of data scientists on-hand to perform hand-cut custom data science. For what most businesses requirements, the typical data scientist is over-skilled. Only other data scientists can understand their work and, importantly, only other data scientists can check their work.

What businesses require for most tasks are people with the data-engineering skills of data scientists and not necessarily their statistical skills or their understanding of a scientific-method of analysis.

Data engineering on a big scale is fraught with challenges. While Excel and Google Sheets can handle relatively large (~1mn row) datasets there is not really a similar software solution that allows easy visualization and manipulation of larger data sets. NoSQL / SQL-databases are required for super-scale data engineering, but this requires skills of the super-user. As 'data-is-the-new-oil' mantra makes its way into businesses, people will become exposed to a growing number datasets that are beyond the realm of the software available to them and, potentially, their skill sets.

At Knowledge Leaps we are building a platform solution for this future audience and these future use-cases.The core of the platform are two important features: Visual Data Engineering pipelines and Code-Free Data Science.

The applications of these features are endless; from building a customer data lake, or building a custom-data-pipeline for report generation or even creating simple-to-evaluate predictive models.