Awareness Doesn’t Diminish Bias Effect

In an interview with Shane Parrish the co-creator of Behavioral Economics, Daniel Kahneman, was asked if he was better at making decisions after studying decision-making for the past 40 years. His answer was a flat no. He then elaborated, saying that biases are hard for an individual to overcome. This dynamic is most evident in the investment community, especially start-up investors. WeWork is a good case study in people ignoring their biases. An article in yesterday's Wall Street Journal (Paywall) describes WeWork's external board and investors looking on as the firm missed projections year-after-year. On the run up to the IPO, people were swayed by their biases and despite data to the contrary more gasoline was poured on the fire. It took public scrutiny for the real narrative to come out and for people to see their own biases at play. To be fair to those involved, the IPO process was used to deliver some unvarnished truths to WeWork's C-suite. As Kahneman said, even professional analysts of decision-making get it wrong from time to time. 

What hope do the rest of us have? With the right data it is easier to at least be reminded of your biases, even if you choose to accept them. With our data and analytics platform we have built two core components that give you and your team a greater opportunity of not falling into a bias trap.

Narrative Builder

This component uses an algorithm that outputs human-readable insight into the relationships in your data. Using correction techniques and cross-validation to avoid computational-bias you can identify the cold-facts when it comes to the relationships (the building blocks of the narrative) in your data. 

Collaborative Insight Generation

The second component we have built to help diminish bias is a collaboration feature. As you analyze data and produce charts other members of your team and provide input and hypotheses for each chart. Allowing a second, third or even fourth pair of eyes to interpret data helps build a resilient narrative.

Surfacing a bias-free narrative is only part of the journey, we still need to convince other humans, with their own biases, of the story discovered in the data. As we have learnt in recent years, straight facts aren't sufficient conditions of belief. At least with a collaborative approach we can help overcome bias traps.

Surfacing a bias-free narrative is only part of the journey, we still need to convince other humans, with their own biases, of the story discovered in the data. As we have learnt in recent years, straight facts aren't sufficient conditions of belief. At least with a collaborative approach we can help overcome bias traps.

One Chart Leads To Another, Guaranteed.

We have just released the charting feature in Knowledge Leaps. The ethos behind the design is this: in our experience, if you are going to make one chart using a data set you are probably going to make many charts using the data.

Specifying lots of charts one-by-one is painful, especially as a data set will typically have lots of variables that you want to plot against one specific variable, date for example. Our UI has been built with this in mind: specify multiple charts quickly, and simply, then spend the time you save putting your brain to work figuring out what the data narrative is.

Charts tend to get buried further into a silo - either as part of a workbook or a presentation. This requires contextual knowledge: to know where the chart is. In other words, you need to know where the chart is to know what story it tells. This is suboptimal, so we fixed that too. Knowledge Leaps platform lets all the your charts remain searchable and shareable. That also goes for your co-workers' charts as well. This feature allows insight to be easily discovered and shared with a wider team - helping build persistent-state organizational intelligence, faster.

Market Research 3.0

In recent years, there has been lots of talk about incorporating Machine Learning and AI into market research. Back in 2015, I met someone at a firm who claimed to be able scale up market research survey results from a sample of 1,000 to samples as large as 100,000 using ML and AI.

Unfortunately that firm, Philometrics, was founded by Aleksandr Kogan - the person who wrote the app for Cambridge Analytica that scraped Facebook data using quizzes. Since then, the MR world has moved pretty slowly. I have a few theories but I will save those for later posts.

Back on topic, Knowledge Leaps got a head start on this six years ago when we filed our patent for technology that automatically analyzes survey data to draw out the story. We don't eliminate human input, we just make sure computers and humans are put to their best respective uses.

We have incorporated that technology into a web-based platform: www.knowledgeleaps.com. We still think we are a little early to market but there might be enough early adopters out there now around which we can build a business. 

As well as reinventing market research, we will also reinvent the market research business model. Rather than charge a service fee for analysis, we only charge a subscription for using the platform.

Obviously you still have to pay for interviews to gather the data, but you get the idea. Our new tech-enabled service will dramatically reduce the time-to-insight and the cost-of-insight in market research. If you want to be a part of this revolution, then please get in touch: Doug@knowledgeleaps.com.

Fear-Free Databases: No Code No SQL – Use Case

We rolled out our No Code Database feature today. Just plug in a data feed and add data to a customizable database with zero lines of code, and zero knowledge of the inner workings of databases. All this in under a minute.

Setting up a database in the cloud is confusing and complex for most people. Our technology puts the power of cloud-based databases at everyone's finger tips. No need for the IT team's intervention. No need to learn remote login protocols. No need to learn any code.

We have also added in some useful aggregation and summarization tools that let you extract data from databases straight into reports and charts. Again, no code required.

Ikeanomics

This is the valuing of your own labor rate that takes place after your third or fourth trip back from Ikea. You know you have saved some money buying a set of shelves that you need to assemble but part of the decision was made by assessing how much time it would take to put the item together vs how much you saved.

Ikea is in the business in devaluing our self-perceived labor rate so that they can charge the most for a flatpack item such that the discount achieved justifies the hours needed to assemble the item. (This is the same model used by meal-kit businesses, or at least it should be.)

For items that do not require assembly then the trade-off people have to make is their willingness to buy products that do not comply with the standards for that type of product bought everywhere else. For example, a desk lamp from Ikea requires no assembly so there is no time-cost to save. To justify the lower price there must be an investment from the customer. In this case it is the willingness to accept a non-standard shade fitting. The same is true of other non-assembly products sold at Ikea.

For those folks interested in alternative data, there could be a macro signal regarding wage earnings and wage growth buried in this data. Comparing the price of an Ikea product with a similar (assembled) non-Ikea product over time could be a useful economic indicator.

New User Guide

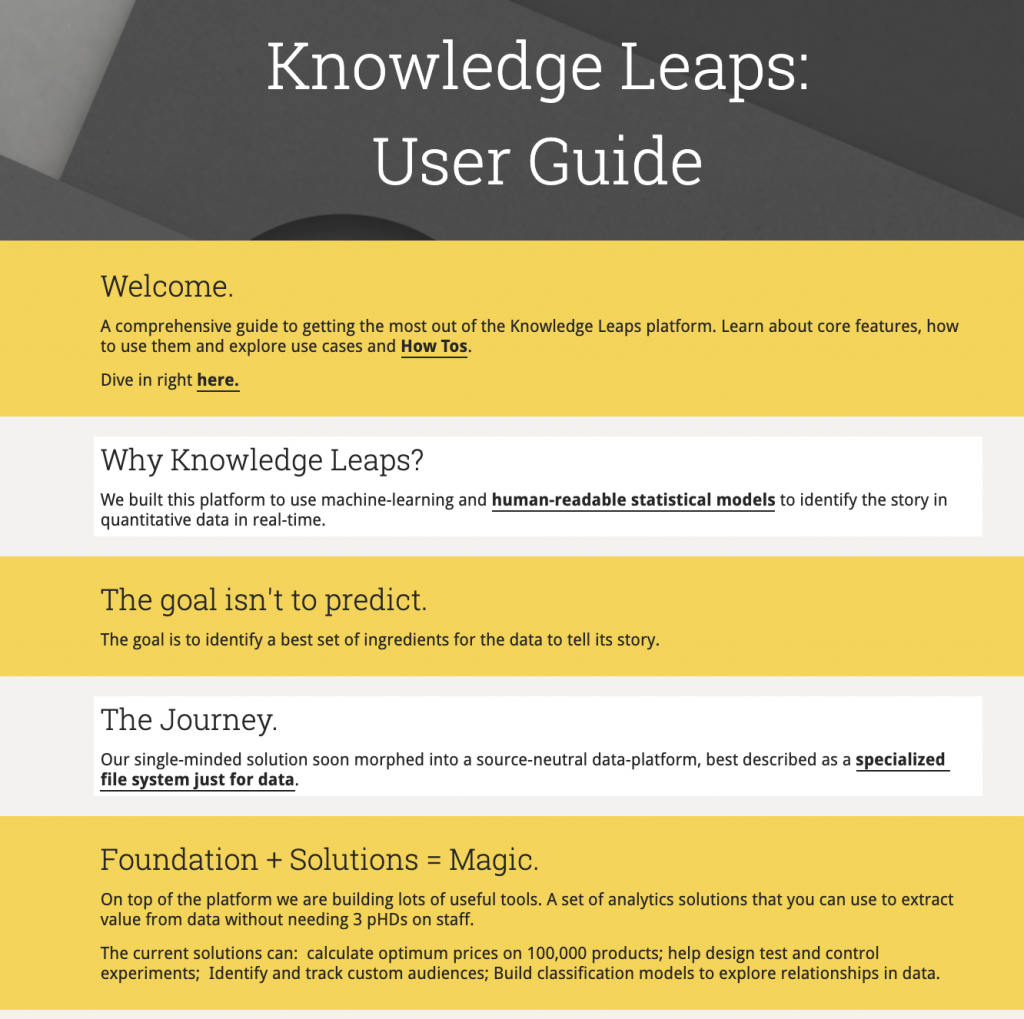
We have upgraded our online user guide. We have added pages on new functionality and pages on some use cases for the platform. It is a living document so it will change regularly over the next days, weeks and months as we add new content to it. Here is a link to the site. Enjoy!

No Code Data Engineering #2

We are adding to our no-code data engineering use cases. Our new Collection Manager feature plugs data pipelines into databases with no code just using a simple drag-and-drop interface.

This feature allows users with zero knowledge of databases and query languages to import data into a database. An additional UI will then allow them to create queries, aggregations and extracts using a simple UI.

The UI can be set up to update the database with new data as it is arrives from external sources, it will also automate extract creation as new data is added.

Example use-cases for this feature would be in the creation of data feeds for dashboards that auto-populate, or creating custom data products which can be timed with a guaranteed delayed delivery time. This feature will also drive our retail experimentation business - we can design and set up a data framework that captures and tags the results from test-and-learn activity.